Overview
Runtime Execution is the production environment where your FrameworX solution operates in real-time. The Runtime engine (TServer) processes all solution logic, manages communication with field devices, executes scripts, logs data, and serves information to clients. Runtime provides high-performance execution with built-in redundancy, diagnostics, and hot-reload capabilities for 24/7 industrial operations.
Core Architecture Components
Three-Tier Architecture
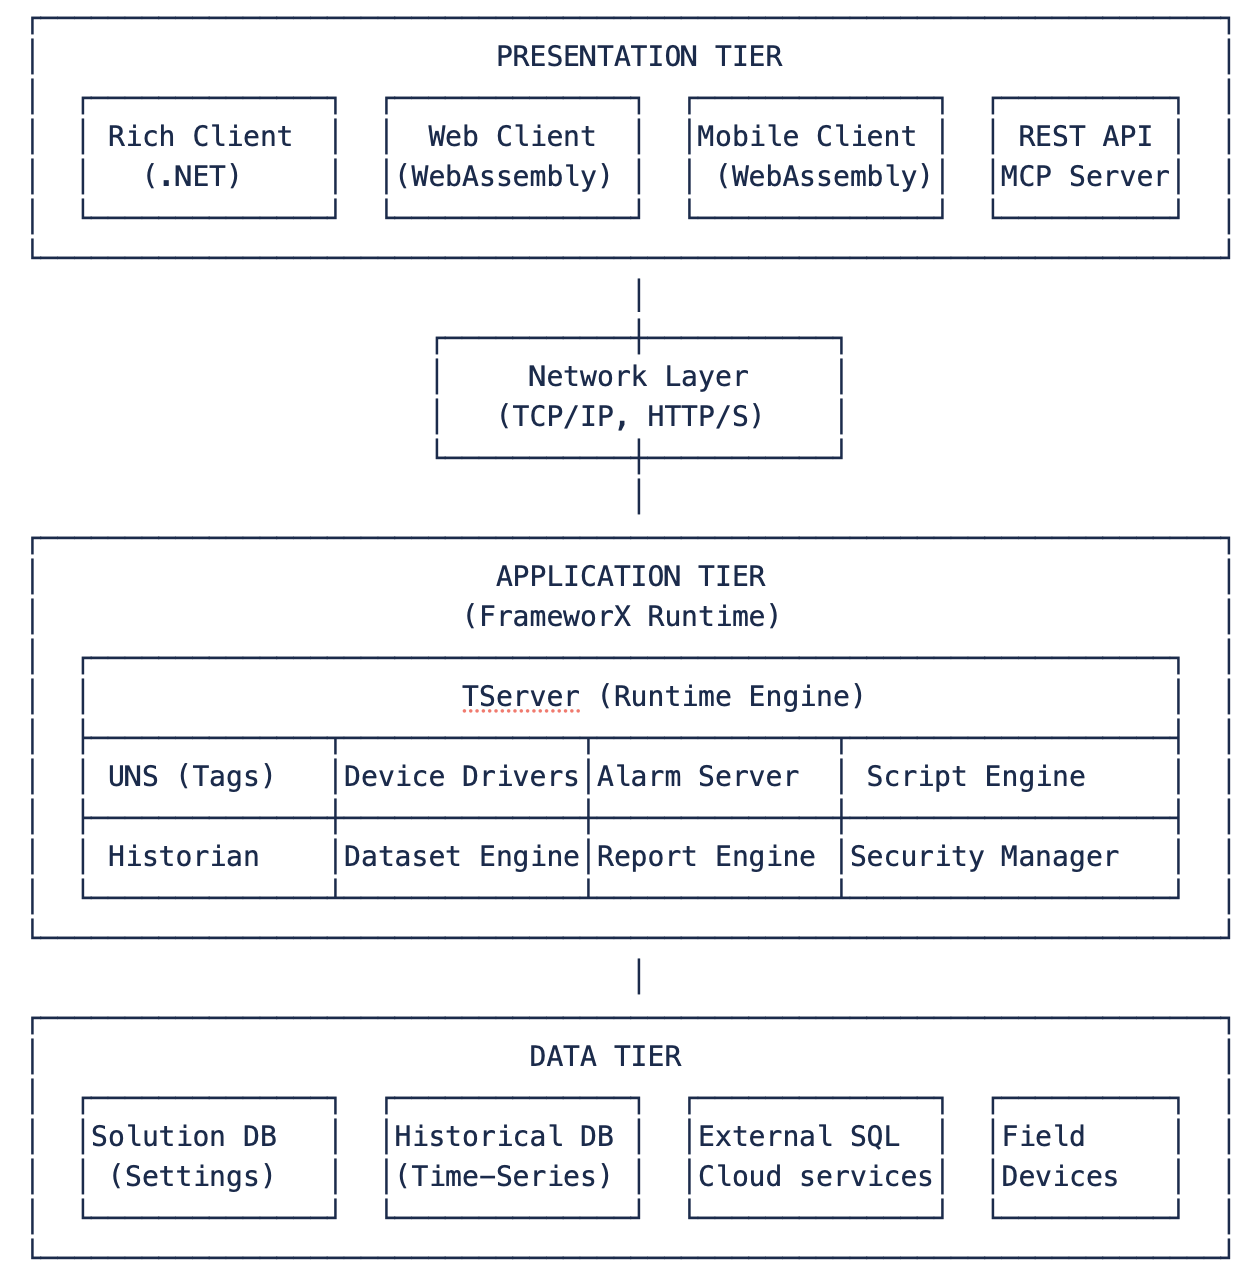
Runtime is the execution layer that brings your solution to life:
- Launched from - Solution Center with selected execution profile
- Loads - Solution configuration from database
- Executes - All modules in real-time coordination
- Serves - Data to multiple client types simultaneously
- Integrates - With field devices and enterprise systems
Runtime Architecture
TServer (Runtime Engine)
Core execution service managing all runtime operations:
- Module Coordination - Synchronizes all solution modules
- Memory Management - Optimized tag database in RAM
- Thread Pool - Parallel execution of tasks
- Event System - Real-time event propagation
- Communication Layer - Client and device connections
Runtime Modules
Each module runs as coordinated subsystem:
- Tag Processor - Real-time value updates and calculations
- Device Manager - Field communication scheduling
- Alarm Processor - Condition evaluation and notification
- Historian Service - Time-series data collection
- Script Engine - Task and expression execution
- Client Server - Multi-client connection management
Execution Profiles
Development Profile
For testing and debugging:
- Full Diagnostics - Verbose logging enabled
- Online Configuration - Hot-reload changes
- Performance Monitoring - Detailed metrics
- Break Points - Script debugging support
- Simulation Mode - Test without devices
Validation Profile
For system testing and validation:
- Production Logic - Real execution paths
- Limited Diagnostics - Balanced logging
- Change Tracking - Configuration audit
- Test Clients - Controlled access
- Performance Baseline - Establish metrics
Production Profile
For live operations:
- Optimized Performance - Maximum throughput
- Security Enforced - Full authentication
- Minimal Logging - Only errors and warnings
- Redundancy Active - Hot-standby enabled
- Auto-Recovery - Self-healing features
Starting Runtime
Startup Sequence
- Initialize Database - Connect to solution database
- Load Configuration - Read all module settings
- Allocate Memory - Create tag database in RAM
- Start Services - Initialize each module
- Connect Devices - Establish field communications
- Accept Clients - Enable client connections
Startup Options
- Normal Start - Standard production operation
- Test Mode - With Designer connection
- Maintenance Mode - Limited functionality
- Cold Start - Clear retained values
- Warm Start - Preserve runtime values
Command Line Parameters
TServer.exe [solution] [options]
  /solution:path     - Solution file path
  /profile:name      - Execution profile
  /port:number       - Server port
  /redundancy:mode   - Standalone or primary/backup
  /trace:level       - Diagnostic level
Server Components
Tag Runtime Database
High-performance in-memory database:
- Real-time Updates - Microsecond timestamp resolution
- Value Caching - Minimize device reads
- Quality Codes - OPC-compliant quality
- Change Detection - Event on value change
- Retentive Storage - Preserve through restart
Communication Manager
Handles all external connections:
- Device Channels - Concurrent device polling
- Client Connections - Multiple simultaneous clients
- Protocol Handlers - Native driver execution
- Buffer Management - Store-and-forward capability
- Connection Pooling - Optimize resources
Event Processor
Central event handling system:
- Event Queue - Priority-based processing
- Event Routing - Targeted distribution
- Event History - Audit trail maintenance
- Event Actions - Triggered responses
- Event Filtering - Reduce noise
Module Execution
Device Module Runtime
- Polling Scheduler - Optimized scan cycles
- Event Subscriptions - Unsolicited data
- Error Recovery - Automatic reconnection
- Data Buffering - Handle communication loss
- Protocol Statistics - Performance metrics
Alarm Module Runtime
- Condition Evaluation - Real-time checking
- State Machine - Alarm lifecycle tracking
- Notification Engine - Email, SMS, audio
- Acknowledgment - User interaction tracking
- Alarm History - Complete audit trail
Historian Module Runtime
- Data Collection - Configurable rates
- Compression - Dead-band and swinging door
- Store and Forward - Handle database outages
- Aggregation - Automatic calculations
- Data Aging - Automatic archival
Script Module Runtime
- Task Scheduler - Time and event triggers
- Expression Engine - Real-time calculations
- Class Libraries - Loaded assemblies
- Error Handling - Exception management
- Performance Monitoring - Execution timing
Client Types
Rich Client (.NET)
Full-featured Windows desktop client:
- Direct Connection - TCP/IP to TServer
- Full Graphics - WPF rendering engine
- Local Scripts - Client-side execution
- Multiple Monitors - Extended desktop
- Offline Capability - Cached operation
Web Client (HTML5)
Browser-based zero-install client:
- WebSocket Connection - Real-time updates
- Responsive Design - Desktop to mobile
- Cross-Platform - Any modern browser
- Secure Connection - HTTPS/WSS
- No Plugins - Pure HTML5/JavaScript
Mobile Client
Native iOS and Android applications:
- Optimized Interface - Touch-friendly
- Push Notifications - Alarm alerts
- Offline Mode - Store and sync
- GPS Integration - Location awareness
- Camera/Barcode - Data input
Data Client
Programmatic access for integration:
- REST API - Read/write tag values
- GraphQL - Complex queries
- WebSocket - Real-time subscriptions
- OPC UA - Standard protocol
- MQTT - IoT integration
Performance & Diagnostics
Performance Metrics
Real-time monitoring of system health:
- CPU Usage - Per module breakdown
- Memory Consumption - Tag database size
- Network Traffic - Client and device bandwidth
- Disk I/O - Historian and log writes
- Thread Count - Active execution threads
Diagnostic Tools
Runtime Trace
Detailed execution logging:
- Module Traces - Individual module activity
- Communication Trace - Protocol messages
- Script Trace - Execution flow
- Performance Trace - Timing analysis
- Error Trace - Exception details
Info Monitor
Real-time status dashboard:
- Module Status - Running/stopped/error
- Client List - Active connections
- Device Status - Communication health
- Alarm Summary - Active alarm counts
- Performance Graphs - Trending metrics
Property Watch
Live tag monitoring:
- Tag Values - Real-time updates
- Quality Codes - Communication status
- Timestamps - Last update time
- Write Source - What changed value
- Statistics - Min/max/average
Log Files
Persistent diagnostic information:
- Server Log - Main runtime events
- Module Logs - Individual module files
- Error Log - Exceptions and failures
- Audit Log - Security and changes
- Performance Log - Metrics history
Hot-Standby Redundancy
Configuration
Primary and backup server setup:
- Shared Database - Common configuration
- State Synchronization - Real-time mirroring
- Virtual IP - Transparent failover
- Heartbeat Monitor - Health checking
- Split I/O - Load distribution
Failover Process
Automatic switchover on failure:
- Failure Detection - Heartbeat timeout
- Backup Activation - Assume primary role
- Client Redirect - Automatic reconnection
- State Recovery - Restore last values
- Notification - Alert administrators
Synchronization
Keeping servers aligned:
- Configuration Sync - Database replication
- Runtime Values - Memory synchronization
- Alarm States - Active alarm mirroring
- Historical Data - Redundant collectors
- Client Sessions - Connection state
Online Configuration
Hot-Reload Capability
Change configuration without stopping:
- Tag Addition - Add new tags live
- Display Updates - Modify screens
- Script Changes - Update logic
- Device Modifications - Adjust polling
- Security Updates - User management
Online Change Process
- Make Changes - In Designer test mode
- Validate - Check for conflicts
- Apply Online - Send to runtime
- Verify - Confirm activation
- Save - Persist to database
Limitations
Some changes require restart:
- Database connection strings
- Server port numbers
- Redundancy configuration
- Module enable/disable
- License changes
Security & Access Control
Authentication Methods
- Windows Authentication - Active Directory integration
- Forms Authentication - Built-in user database
- Certificate Authentication - Smart cards/certificates
- Two-Factor - Additional verification
- Single Sign-On - Enterprise SSO integration
Authorization Levels
- Administrator - Full system control
- Engineer - Configuration changes
- Supervisor - Operational control
- Operator - Basic operation
- Viewer - Read-only access
Security Features
- Encrypted Communication - TLS/SSL
- Audit Trail - Complete activity log
- Auto-Logout - Inactivity timeout
- IP Filtering - Connection restrictions
- Password Policy - Complexity requirements