Page Tree
Other Releases
...
| Info | ||||
|---|---|---|---|---|
| ||||
The following document describes the usage of the Dashboard Displays. |
A dashboard is a type of graphical user interface which often provides at-a-glance views of key performance indicators (KPIs) relevant to a particular objective.
A data dashboard is the most efficient way to track multiple data sources because it provides a central location for businesses to monitor and analyze performance. The data is displayed in the form of tables, line charts, bar charts and gauges.
To create a Dashboard page you need to navigate to the Draw Editor and click at the Create Display button.
...
| Info |
|---|
Dashboards are available for both .Net and HTML5 display types. |
The following elements are available in Dashboard Displays.
...
Bar Chart | Calculator | Web Browser |
| Pie Chart | Circular Panel | Assets/RemoteAssets Configuration |
Advanced Pie Chart | File Explorer | Child Display |
| 3D Pipe Viewer | External DLLs | Page Selector |
| Report Preview | XPS/PDF Viewer | |
| Map/GMap Control | Report Viewer |
The Draw Editor when dashboard option is enabled has its layout configured in blocks.
...
Dashboard elements have a property called Title that can be accessed through the panel on the left-side of the Draw Editor.
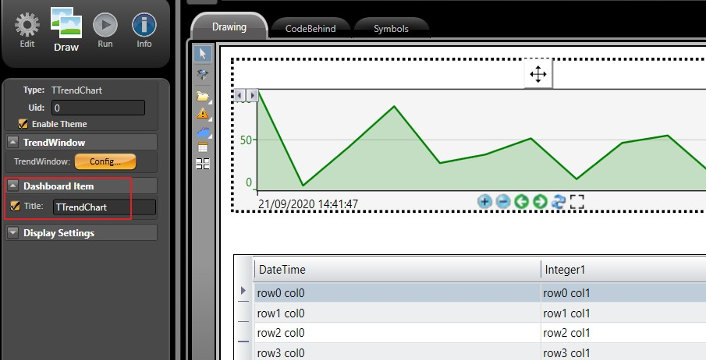
Title Configuration.
Dashboards can have their appearance modified by applying different Themes. On Run-Extension-Themes
...
This feature is enabled on the left Panel CheckBox.
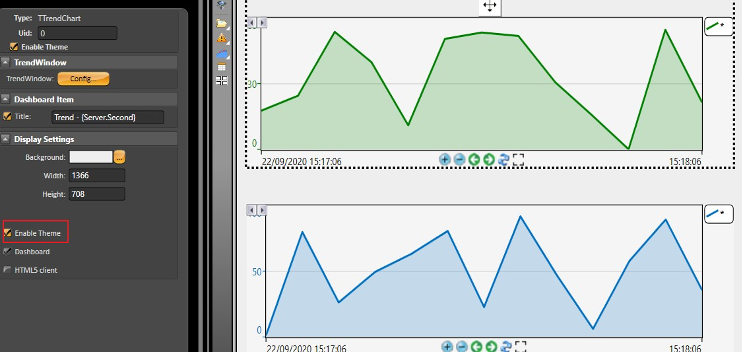
Enabling themes.
The Dashboard items can have their propertied modified through the callback added to the CodeBehind using the syntax below:
...