Introduction to the Runtime
![]()
Runtime Module Overview
The Runtime Module executes your configured solution, transforming the static configuration into an active system. It loads tags into memory, processes real-time data, executes scripts and alarms, and serves information to clients - making your solution come alive.
The Runtime Environment is the active stage where a Solution starts and operates.
Executing a Solution, or starting the Runtime, involves:
- Loading all functional modules for execution
- Acquiring and processing data and updating visual displays
- Performing all tasks based on the Solution's configuration
When the Runtime Environment loads the module's configuration. Some settings, such as network addresses and database connections, can be applied according to the execution profile. Profiles enable the same solution configuration to interface with various databases and devices, accommodating different phases of the solution life cycle, such as Development, Validation, or Production.

On this Page:
- Runtime Module Overview
- Key Concepts
- What It Does
- Configuration Workflow
- Runtime Behavior
- Feature Highlights
Key Concepts
- TServer.exe: The core process that runs your solution
- Execution Profile: Different settings for Development vs Production
- Real-Time Database: Tags and data held in memory for fast access
- Online Changes: Modify the running solution without stopping
- Test Mode: Run and debug from within Designer
- Build & Publish: Create validated versions for deployment
What It Does
- Starts and stops solution execution
- Loads tags and templates into memory
- Runs all configured modules (Devices, Alarms, Scripts, etc.)
- Manages connections to databases and field devices
- Serves data to displays and clients
- Monitors performance and system health
Key Concepts and Terms
The purpose of the Runtime Environment is to actively operate configured solutions, executing real-time data acquisition, scripts, alarms, and all items from all modules. It represents the essential final phase of solution development, delivering the application's functionality.
Runtime
The term "Runtime" or "Runtime Environment" refers to the execution environment when the solution is running, distinguishing it from the Configuration (or Engineering, or Development) phase. "Runtime" also denotes the software components and computer processes that are in execution when the solution is started.
Execution Profile
An Execution Profile consists of settings that allow customization of database connections and device network addresses. This enables the management of different environments.
Online Configuration
This feature allows real-time modifications to a running solution without stopping its execution. Users can adapt the solution to changing requirements, enhancing flexibility and responsiveness.
Hot Updates / Hot Reload
Hot Updates are a subset of online configurations that allow the application of offline solution changes without disrupting the runtime environment. They maintain solution stability and prevent downtime, ensuring the solution remains up-to-date with the latest changes.
Build and Publish
The Build process involves compiling the solution code. The Publish process creates a read-only version of the solution for distribution in regulated sites.
Understanding the Runtime Environment
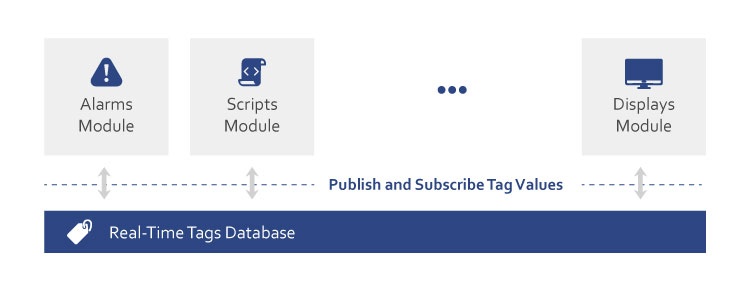
Real-Time In-Memory Database
When the solution is in execution, variables like Tags, Templates, and Assets are loaded into the memory. These variables act as a central point of reference, allowing other functional modules to request or publish values as they perform their functions. The computer process and executable responsible for maintaining the real-time database is TServer.exe. This application can run as a Windows Service or be deployed to Linux and other supported operating systems.
Runtime Fundamentals
Startup Procedure
→ For details on the startup procedure review the Runtime Startup Settings page.
→ For details on setting up the execution review the Solution Deployment (Reference) page.
Runtime in the Four Pillars (Concept)
Runtime Execution Overview
During Runtime, the Four Pillars transform from static configuration into an active system. Each pillar operates as an independent yet interconnected layer, with data flowing from field devices through the foundation layer, processed by business logic, and presented to users through visualization interfaces.
On this Page:
- Runtime Execution Overview
- Key Concepts
- What Happens at Runtime
- Pillar Interactions
- Execution Profiles
- Performance Characteristics
Key Concepts
- Pillar Activation: Each pillar becomes an active process or service during execution
- Data Flow Direction: Information moves upward through pillars, commands flow downward
- Module Independence: Each pillar's modules run as separate processes
- Memory-Based Operation: UNS maintains all real-time data in RAM
- Event-Driven Architecture: Changes propagate through publish-subscribe patterns
- Profile-Based Behavior: Same configuration runs differently in Dev vs Production
What Happens at Runtime
When a solution starts, each pillar activates in sequence:
- Foundation loads - Tags and templates enter memory
- Process modules connect - Field devices start communicating
- Application logic initiates - Scripts and datasets begin processing
- Interface serves - Displays become available to clients
Pillar Interactions
Data Flow Pattern
[Field] → [Devices] → [UNS Tags] → [Scripts] → [Displays]
           ↓            ↓            ↓           ↓
        [Alarms]    [Historian]  [Datasets]  [Clients]
Communication Methods
From Pillar | To Pillar | Method |
|---|---|---|
| Process → Foundation | Tag writes | Direct memory update |
| Foundation → Application | Tag changes | Event notifications |
| Application → Foundation | Calculated values | Tag writes |
| Foundation → Interface | Value updates | Subscription/publish |
| Interface → Foundation | Operator commands | Tag writes |
Execution Profiles
Different runtime behaviors for the same configuration:
Development Profile
- Local SQLite databases
- Full diagnostic logging
- Online configuration allowed
- Test data sources
- Debug information visible
Production Profile
- Enterprise SQL databases
- Optimized logging
- Configuration locked
- Live data sources
- Performance optimized
Runtime & Clients — Overview
The Runtime executes your solution (real-time tags, UNS, modules, utilities). Clients (desktop & web) visualize and interact with the running system. This page explains how execution works and how clients connect.
On this page
Execution model (Runtime, services, UNS)
Client types (desktop, web)
Basic diagnostics you’ll use first
Runtime Components
| Component | Function | Access |
|---|---|---|
| TServer | Core execution engine | Runs as service |
| Tag Database | Real-time data storage | In-memory |
| Module Engines | Execute specific functions | Auto-started |
| Client Server | Serves displays to clients | TCP port 9000 |
Component Relationships
- TServer hosts the tag database
- Modules connect to TServer for data exchange
- Client Server retrieves data from TServer
- All components share the solution configuration
Execution Modes
Development Mode
- Full diagnostics enabled
- Detailed error messages
- Performance monitoring
- Online configuration changes
Production Mode
- Optimized performance
- Minimal logging
- Security enforced
- Stable operation
The same solution behaves differently based on the execution mode, controlled by the Execution Profile selected at startup.
Client Types
Runtime supports multiple client types simultaneously:
Desktop Client (Rich)
- .NET WPF application
- High-performance graphics
- Local installation required
- Direct server connection
Web Client
- HTML5 browser-based
- No installation needed
- Responsive design
- WebAssembly support
Mobile Client
- Adapted web interface
- Touch-optimized
- Works on tablets and phones
- Same server connection
Basic Diagnostics
Three essential tools for monitoring Runtime:
1. Runtime Information
- Access: Solution Center → Tools → Runtime Info
- Shows: Module status, memory usage, connections
- Purpose: Overall system health
2. Property Watch
- Function: Monitor tag values in real-time
- Details: See quality indicators and timestamps
- Usage: Debug data flow and values
3. Diagnostics Window
- Content: View logs and traces
- Analysis: Performance metrics
- Troubleshooting: Error identification
Monitoring Runtime
- Runtime Information
- Solution Center → Tools → Runtime Info
- Shows module status, memory, connections
- Property Watch
- Monitor tag values in real-time
- See quality and timestamps
- Diagnostics
- View logs and traces
- Analyze performance
Runtime (Concept)
Runtime Module Overview
The Runtime Module executes your configured solution, transforming the static configuration into an active system. It loads tags into memory, processes real-time data, executes scripts and alarms, and serves information to clients - making your solution come alive.
On this Page:
- Runtime Module Overview
- Key Concepts
- What It Does
- Configuration Workflow
- Runtime Behavior
- Feature Highlights
Key Concepts
- TServer.exe: The core process that runs your solution
- Execution Profile: Different settings for Development vs Production
- Real-Time Database: Tags and data held in memory for fast access
- Online Changes: Modify the running solution without stopping
- Test Mode: Run and debug from within Designer
- Build & Publish: Create validated versions for deployment
What It Does
- Starts and stops solution execution
- Loads tags and templates into memory
- Runs all configured modules (Devices, Alarms, Scripts, etc.)
- Manages connections to databases and field devices
- Serves data to displays and clients
- Monitors performance and system health
Runtime Behavior
How Runtime Works
When you start the Runtime:
- Solution loads - Configuration is read from the .dbsln file
- Memory initialization - Tags and templates load into RAM
- Modules start - Devices, Alarms, Historians begin operation
- Data flows - Real-time values update across the system
- Clients connect - Displays can now show live data
Development vs Production
Aspect | Development | Production |
|---|---|---|
| Purpose | Testing and debugging | Live operation |
| Database | Local SQLite | SQL Server |
| Diagnostics | Full logging | Minimal overhead |
| Changes | Online edits allowed | Protected operation |
| Performance | Debug information | Optimized speed |
Simple Monitoring
Access runtime information through:
- Solution Center - Start/stop and status
- Designer - Connect to running solution
- Property Watch - See tag values in real-time
- Diagnostics - View logs and performance
Feature Highlights
Easy Execution
- One-click start: Run button in Solution Center or Designer
- Windows Service: Auto-start with Windows
- Multiple profiles: Same solution, different environments
- Remote start: Launch from web interface
Real-Time Operation
- Fast data updates: Millisecond response times
- Event-driven: Changes trigger immediate actions
- Reliable communication: Store-and-forward for network issues
- Scalable performance: From embedded to enterprise
Development Features
- Test Mode: Run without leaving Designer
- Online changes: Modify tags while running
- Hot reload: Update displays instantly
- Property Watch: Monitor any value live
Production Ready
- Build validation: Check all code before deployment
- Published versions: Read-only for regulated environments
- Redundancy support: Hot-standby failover
- Cross-platform: Windows, Linux, Docker
Built-in Diagnostics
- Module status: See what's running
- Performance metrics: CPU, memory usage
- Trace messages: Debug information
- Error logging: Automatic issue tracking
Performance Characteristics
Memory Usage by Pillar
Pillar | Primary Memory Use | Typical Range |
|---|---|---|
| Foundation (UNS) | Tag values, templates | 100MB - 2GB |
| Process Modules | Communication buffers | 50MB - 500MB |
| Application Modules | Script execution | 100MB - 1GB |
| User Interface | Display cache | 50MB - 200MB per client |
Processing Distribution
Parallel Execution: Each pillar's modules run independently
- Device communications don't block displays
- Script calculations don't affect alarm processing
- Database operations isolated from real-time updates
Priority Management: Critical operations get precedence
- Alarm evaluation: Highest priority
- Control commands: High priority
- Historical archiving: Normal priority
- Report generation: Low priority
Startup Sequence
TServer.exe starts (< 5 seconds)
- Loads tag database
- Initializes memory structures
Module activation (5-30 seconds)
- Process modules connect to devices
- Application modules initialize
- Interface prepares client services
Steady state (< 60 seconds)
- All communications established
- Full data flow active
- Clients can connect
untime Behavior
Solution Management Process
The Solution Center maintains a real-time view of all available solutions through file system monitoring and server connections. Solution files (.dbsln) contain complete configurations as encrypted embedded SQL databases, enabling portability and backup.
Access Methods
Solution Center supports three primary access modes:
Local Access: Direct file system access to solutions on the local computer
- Immediate file operations
- Single-user exclusive mode available
- No network requirements
Server Connection: Remote access via TWebServices
- Multi-user collaboration support
- Centralized solution management
- Requires port 10108 open
Web UI Access: Browser-based interface
- URL format:
http://<server>:10108/solutions - No local installation required
- Click-Once Designer deployment
Solution Execution States
| State | Description | Visual Indicator |
|---|---|---|
| Stopped | Solution not running | Gray icon |
| Running | Active in Runtime | Green icon |
| Designing | Open in Designer | Blue icon |
| Error | Execution failure | Red icon |
| Starting | Initialization phase | Yellow icon |