![]() Runtime executes configured solutions, maintaining the real-time database in memory and processing data from field devices. It runs scripts, evaluates alarms, stores historian data, and serves displays to clients. Different execution profiles allow the same configuration to behave appropriately for Development, Validation, or Production environments.
Runtime executes configured solutions, maintaining the real-time database in memory and processing data from field devices. It runs scripts, evaluates alarms, stores historian data, and serves displays to clients. Different execution profiles allow the same configuration to behave appropriately for Development, Validation, or Production environments.
→ Concept | How-to Guide | Reference
On this page:

Key Concepts
| Concept | Description | Details |
|---|---|---|
| TServer.exe | Core execution engine | Process that maintains real-time database |
| Execution Profile | Runtime environment settings | Development, Validation, or Production modes |
| Real-Time Database | In-memory tag storage | Fast access to all solution data |
| Online Configuration | Modify running solution | Changes without stopping execution |
| Hot Reload | Apply updates instantly | No downtime for changes |
| Development Mode | Designer-based execution | Debug without full deployment |
What Runtime Does
| Execution Control | Data Processing | Client Services |
|---|---|---|
|
|
|
How It Fits in the Solution Lifecycle
![]() Runtime is the execution environment in the Solution Lifecycle:
Runtime is the execution environment in the Solution Lifecycle:
- Solution Center - Create and manage solutions
- Designer - Configure all modules
- Runtime ← You are here (Execute and monitor)
Runtime brings your configuration to life, executing all the logic and serving data to clients. It's where your solution delivers value to operations.
How Runtime Works
Real-Time Database Architecture
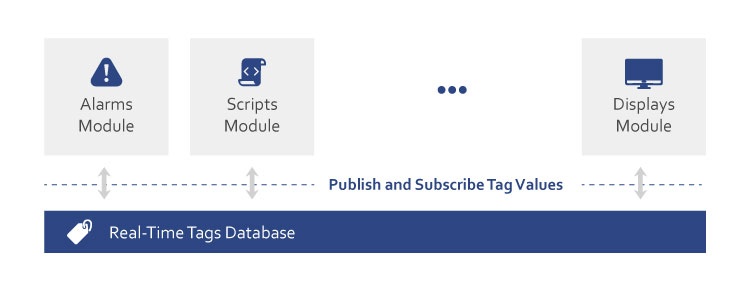
When the solution runs, all tags, templates, and assets load into memory. This in-memory database acts as the central hub where modules publish and request values. The TServer.exe process maintains this database, running as a Windows Service or on Linux/Docker platforms.
Startup Sequence
When you start the Runtime, the following sequence occurs:
1. Solution Load (< 5 seconds)
?? Read .dbsln configuration
?? Validate settings
2. Memory Initialization (5-10 seconds)
?? Load tags and templates
?? Create data structures
?? Initialize TServer.exe
3. Module Activation (10-30 seconds)
?? Start Device communications
?? Enable Alarm processing
?? Begin Historian collection
?? Initialize Scripts
4. Steady State (< 60 seconds)
?? All modules operational
?? Data flow active
?? Ready for clients
(*) The time is estimated, most solutions are much faster, very deployments can go beyond.
The Four Pillars at Runtime
During execution, each pillar transforms into active processes:
Data Flow Through Pillars
Devices → [P1: UNS] → [P2: Process] → [P3: Application] → [P4: Operator UI]
↓ ↓ ↓
Alarms Datasets Clients
Historian Reports
Scripts
| Pillar | Runtime Role | Key Processes |
|---|---|---|
| P1: UNS | Data foundation | Tag database, events |
| P2: Process | Field connectivity | Device drivers, alarm engine |
| P3: Application | Business logic | Script execution, queries |
| P4: Operator UI | Visualization | Display server, client handler |
Execution Profiles
Different runtime behaviors for the same configuration:
| Aspect | Development | Validation | Production |
|---|---|---|---|
| Purpose | Testing & debugging | System verification | Live operation |
| Database | Local SQLite | Test SQL Server | Enterprise SQL |
| Diagnostics | Full logging | Performance metrics | Minimal overhead |
| Changes | Online edits allowed | Limited changes | Protected/locked |
| Data Sources | Simulators/devices | Test devices | Live equipment |
Client Connections
Runtime supports multiple client types simultaneously:
| Desktop Rich Client | Desktop Smart Client | Web Client | Mobile Client |
|---|---|---|---|
.NET WPF application High-performance Local installation Direct connection Full functionality | .NET WPF application High-performance Click-one activation Direct connection Full functionality | HTML5 browser WebAssembly No installation Responsive design Cross-platform | Adaptive layout WebAssembly No installation Touch-optimized Shared content |
Monitoring Runtime
Diagnostic Tools (Desktop)
| Tool | Access | Purpose | Key Information |
|---|---|---|---|
| Runtime Info | Solution Center → Tools | System health | Module status, memory, CPU |
| PropertyWatch | Designer → PropertyWatch | Tag monitoring | Values, quality, timestamp |
| TraceWindow | Designer → TraceWindow | Troubleshooting | Logs, traces, errors |
| ModuleInfo | Designer → ModuleInfo | Module details | Status, performance |
Heath & Monitoring Tools (Desktop & Web & Mobile)
| Tool | Access | Purpose | Key Information |
|---|---|---|---|
| Runtime Monitor | Solution Center → Manage | System health | Module status, memory, CPU |
| Alarms Monitor | Solution Center → Manage | Alarms status | module state, active alarms |
| Historian Monitor | Solution Center → Manage | Historian status | module state, trend charts |
Performance Characteristics
Processing Distribution
- Parallel execution - Modules run independently
- Priority management - Critical operations first
- Event-driven - Changes trigger immediate updates
- Optimized memory - Efficient data structures
Typical Performance Metrics
- Tag updates: < 10ms response
- Alarm evaluation: < 50ms detection
- Display refresh: 100-500ms
- Script execution: Varies by complexity
- Client connections: 100+ concurrent
Feature Highlights
Development Features
- Test Mode - Run from Designer
- Online changes - Modify without stopping
- Hot reload - Instant display updates
- Debug tools - Comprehensive diagnostics
Production Features
- Auto-start - Windows Service mode
- Redundancy - Hot-standby support
- Store-and-forward - Network resilience
- Cross-platform - Windows, Linux, Docker
Built-in Reliability
- Watchdog timers - Auto-recovery
- Module isolation - Fault containment
- Data persistence - Survives restarts
- Error handling - Graceful degradation
Next Steps
Essential Reading
- [Execution Profiles →] - Configure for different environments
- [Client Types →] - Understand display options
- [Diagnostics Guide →] - Monitor and troubleshoot
Practical Guides
- [Starting Runtime] - Step-by-step startup
- [Performance Tuning] - Optimization techniques
- [Deployment Guide] - Production readiness
This page introduces Runtime as the execution heart of your FrameworX solution. Understanding how Runtime transforms configuration into operation helps you design better solutions and troubleshoot effectively.
In this section...